This is the second series describing the ADD: a radically more productive development and delivery environment. The first article is here: Intro and described the truth and lies about developing software. The second article dealt with ‘Testing’. The third dealt with the application stack (Grails and other technologies). The fourth discussed UI alternatives. The fifth added some major aspects to the stack: Semi-Structured Data, Templates, and Dual or Isomorphic scripting. The sixth discussed UI frameworks in a bit more detail and ended with an Angular vs. Ember as a core choice.
Logging, Analytics, and Monitoring
Returning to a bit more of an ‘IT’ issue, how do we handle logging, monitoring, and analytics on our collection of machines? There are a number of choices:
- Run our own infrastructure
- Go with an inexpensive provider
- Go with a more capable provider
- Don’t
Of the above, I believe #3 is usually worth it until your scale gets to the point of needing #1. Downgrading from #3 to #2 is fine after you have learned the capabilities you are giving up.
Logging: SumoLogic
The longest standing, very successful, and SaaS capable company is Splunk (http://splunk.com/) . But their prices are crazy. Have no idea how they can charge that much. So instead I will demo SumoLogic (http://SumoLogic.com/) as the ‘3B’ tier.
Installing SumoLogic is incredibly easy:
1
| |
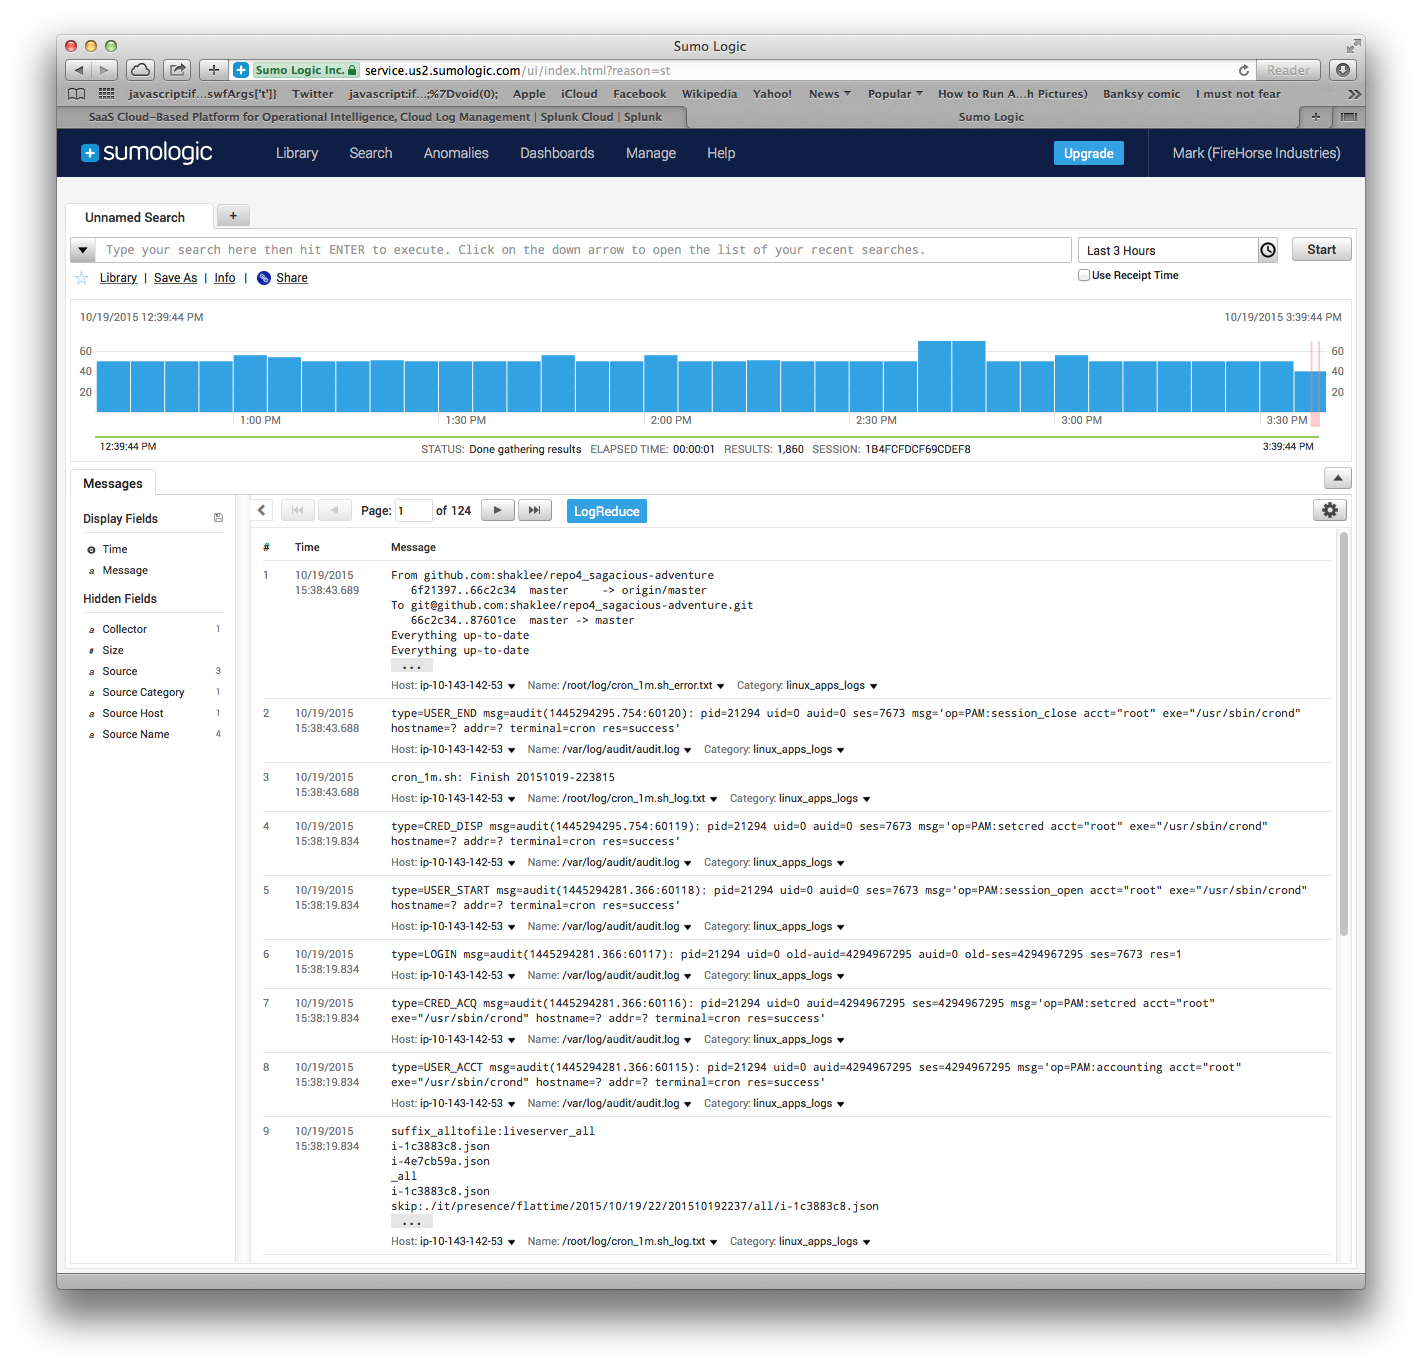
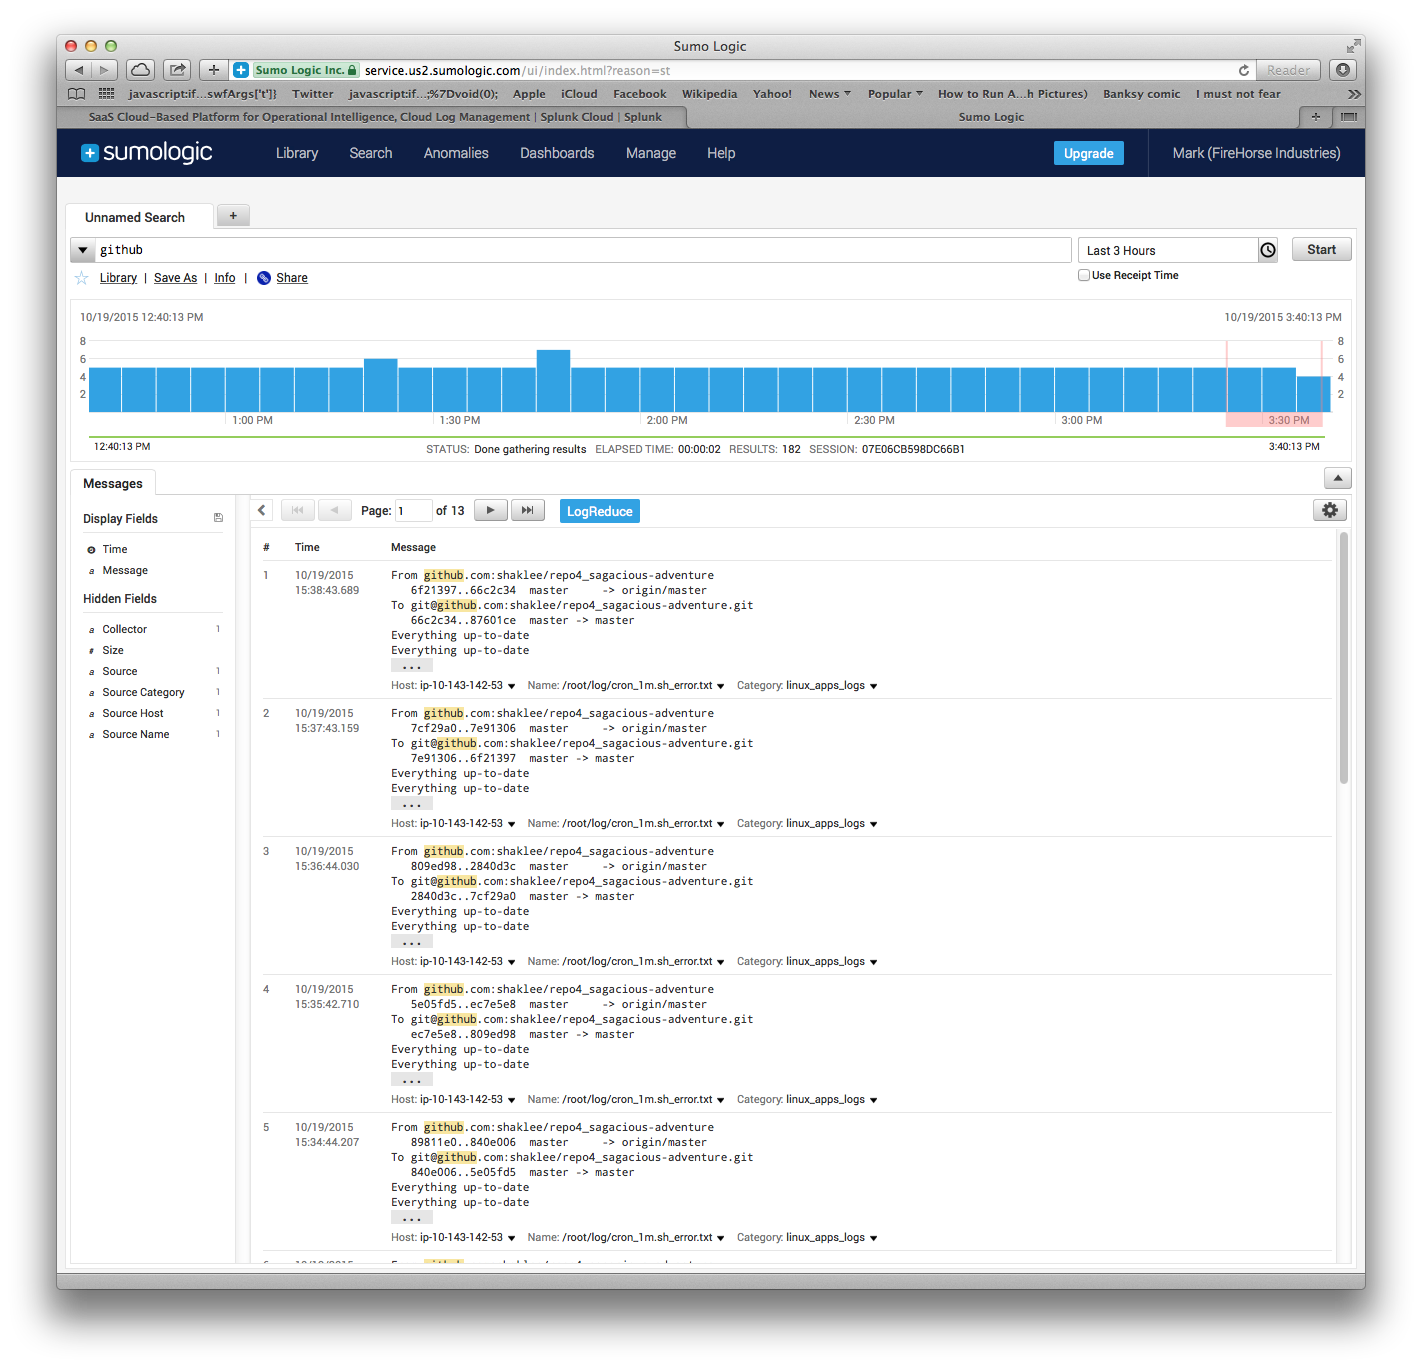
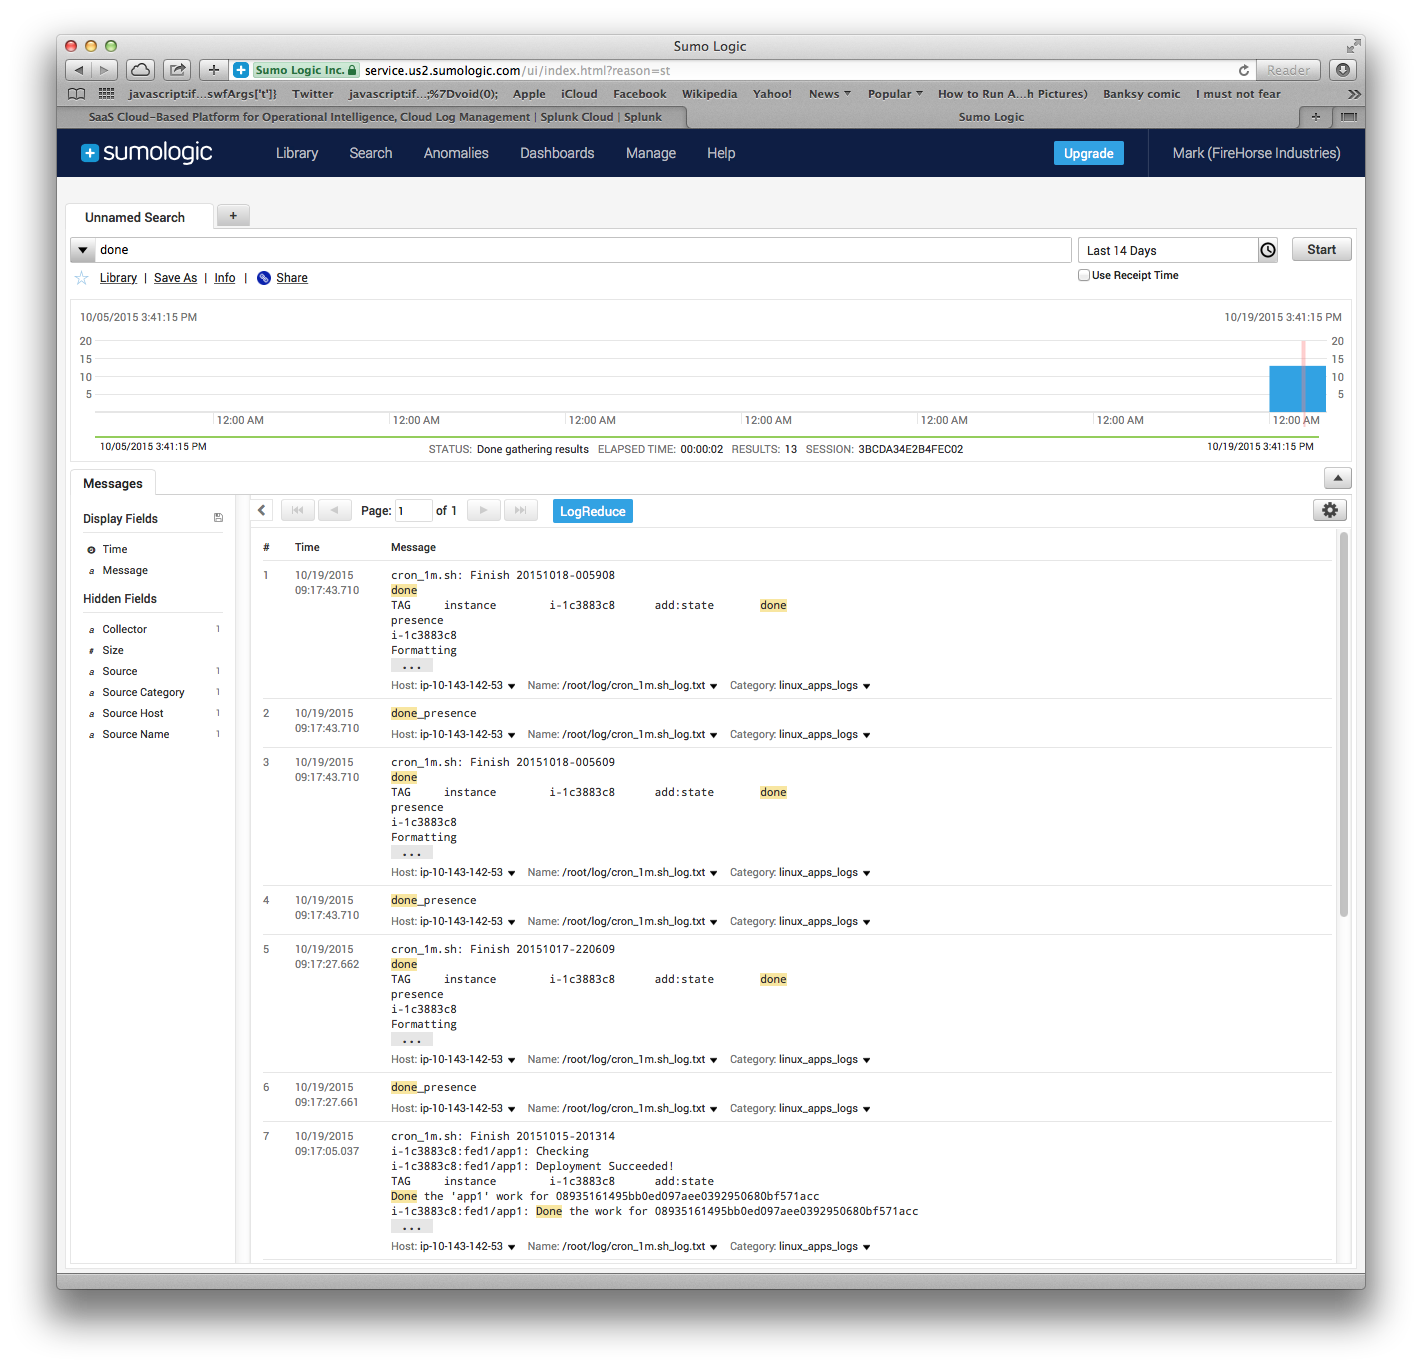
And the collector is on the machine. If you tell it what you want to aggregate, it starts collecting and indexing files in those paths. In our case, the nodes all have files in ‘/root/log’ which it would be nice to have aggregated.
The results are visible here:
Logging Alternative: Graylog
For Rumble, we had a Graylog (http://graylog.com/) cluster that dealt with a tremendous amount of data (half a terabyte a day if memory serves, due to over-enthusiastic logging) and was relatively stable under that load. Elasticsearch had issues if a node failed (just due to the stress of moving data to another backup), but this is under pretty extreme load levels. So if you wanted to roll your own, the Graylog path would be a very inexpensive and powerful path.
Analytics and Monitoring: NewRelic
NewRelic (http://newrelic.com/) started out as a Ruby-oriented monitoring service, and basically came about because Ruby/Rails developers (a) wanted a lot of information about why their apps were running slowly, (b) had very little knowledge about operations and other ways of monitoring things, and (c) Ruby itself has little support for monitoring. NewRelic came along and provided the metrics (as you would expect for Java and similar mature languages) outside the Ruby environment. Initially this could be viewed as a crutch for Ruby where Java didn’t need it, but ultimately by putting the metrics outside the application everyone’s life was simpler.
To install NewRelic, you need to get the agent onto the machine. In our case we are going to leverage the annex:
1 2 3 4 5 6 7 8 9 10 11 12 13 14 15 16 17 18 19 20 21 22 23 24 25 26 27 28 29 30 | |
The first section puts on the system-monitoring agent for newrelic. The second section has two parts. The first part puts the general NewRelic agent onto the machine, and the second part enables us to override (overlay) the default configuration with our own. The most important part is to replace the license, but there are many things that can be configured within the NewRelic agent.
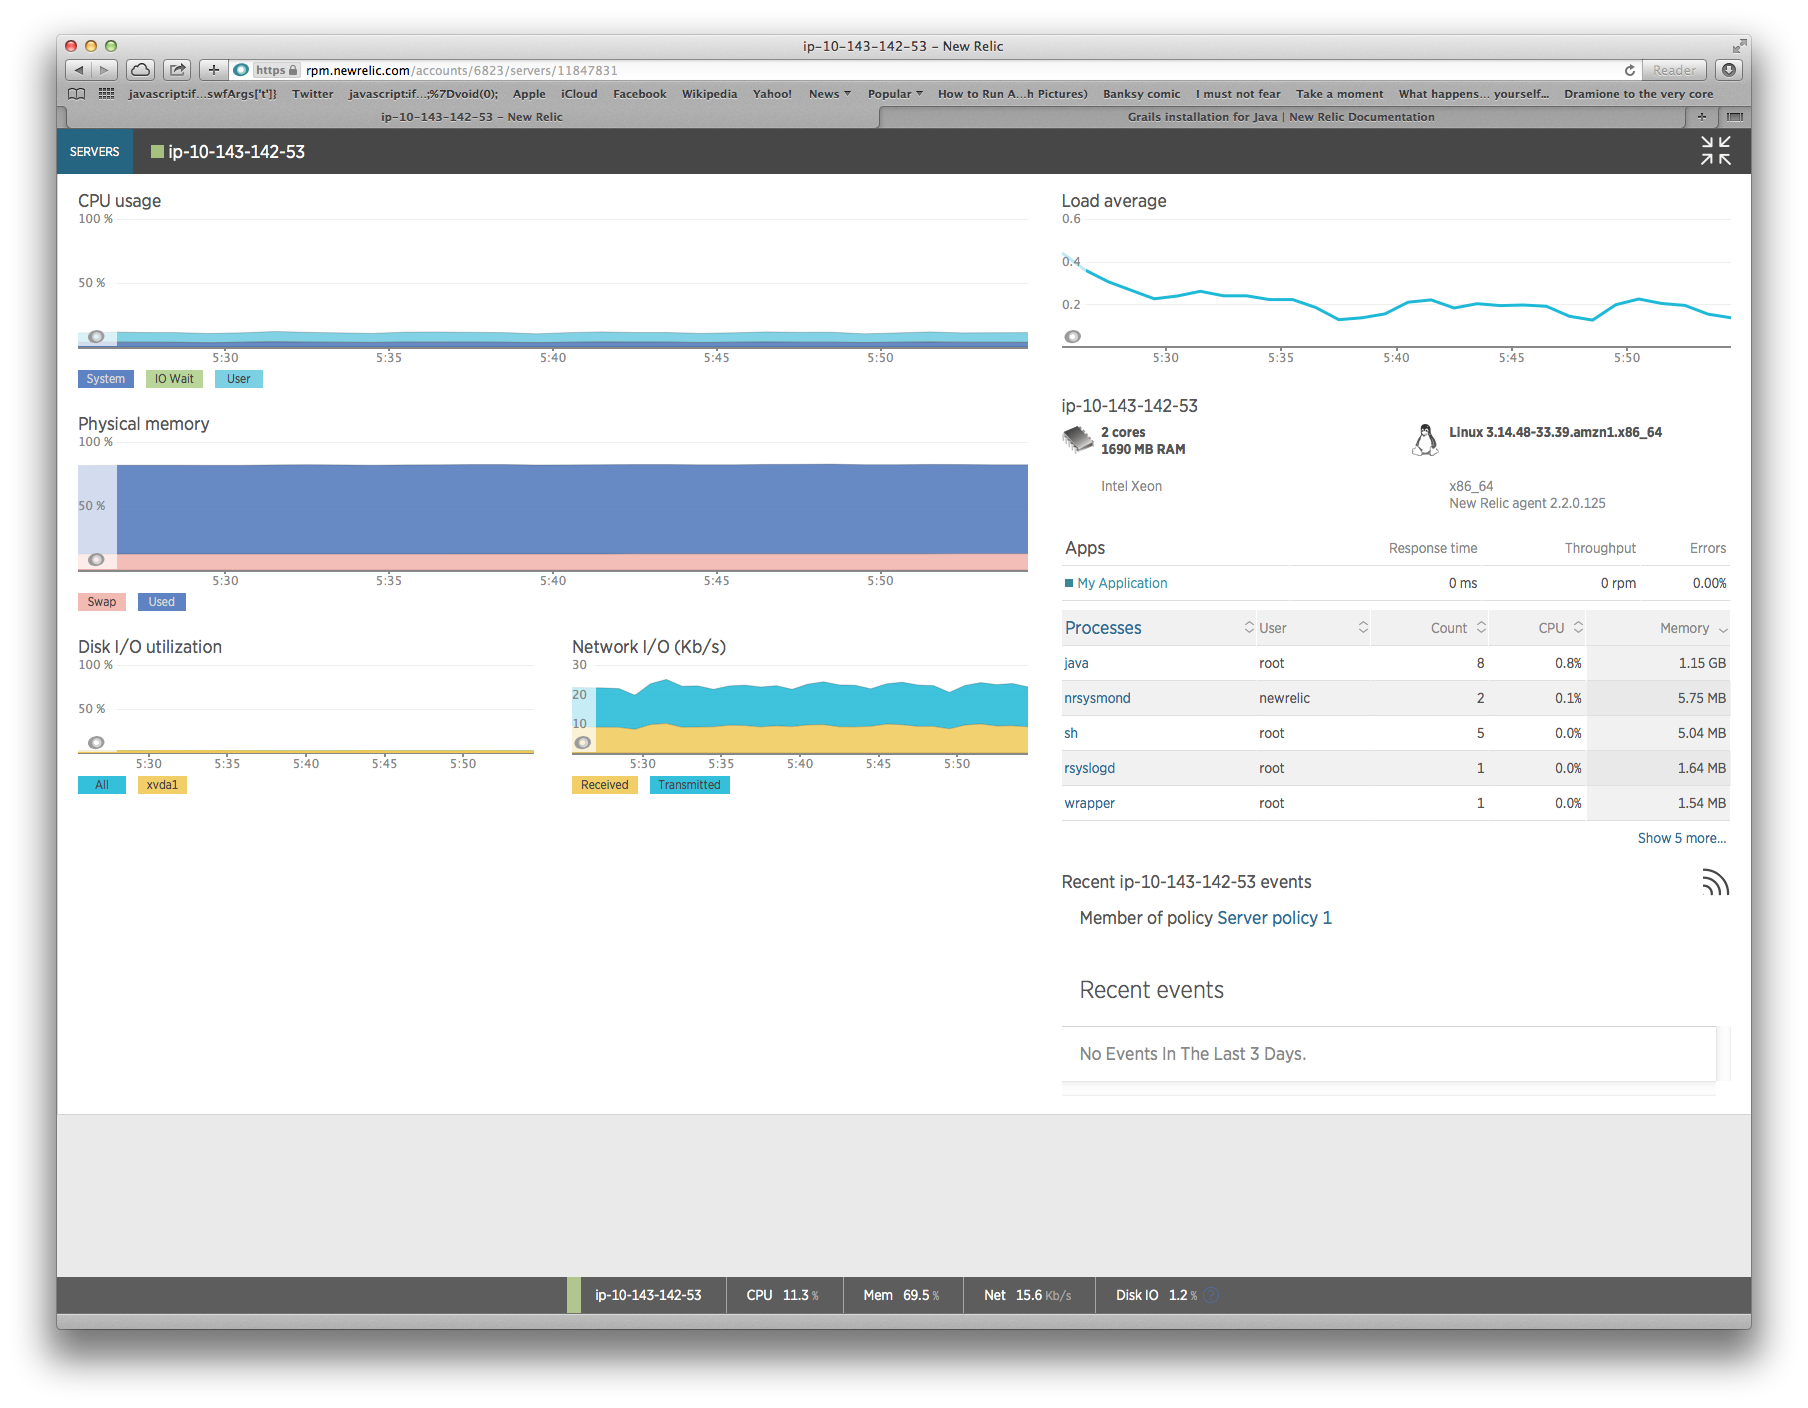
Finally, we need to launch with the agent configuration into the java / ‘gradew’ launcher:
1 2 | |
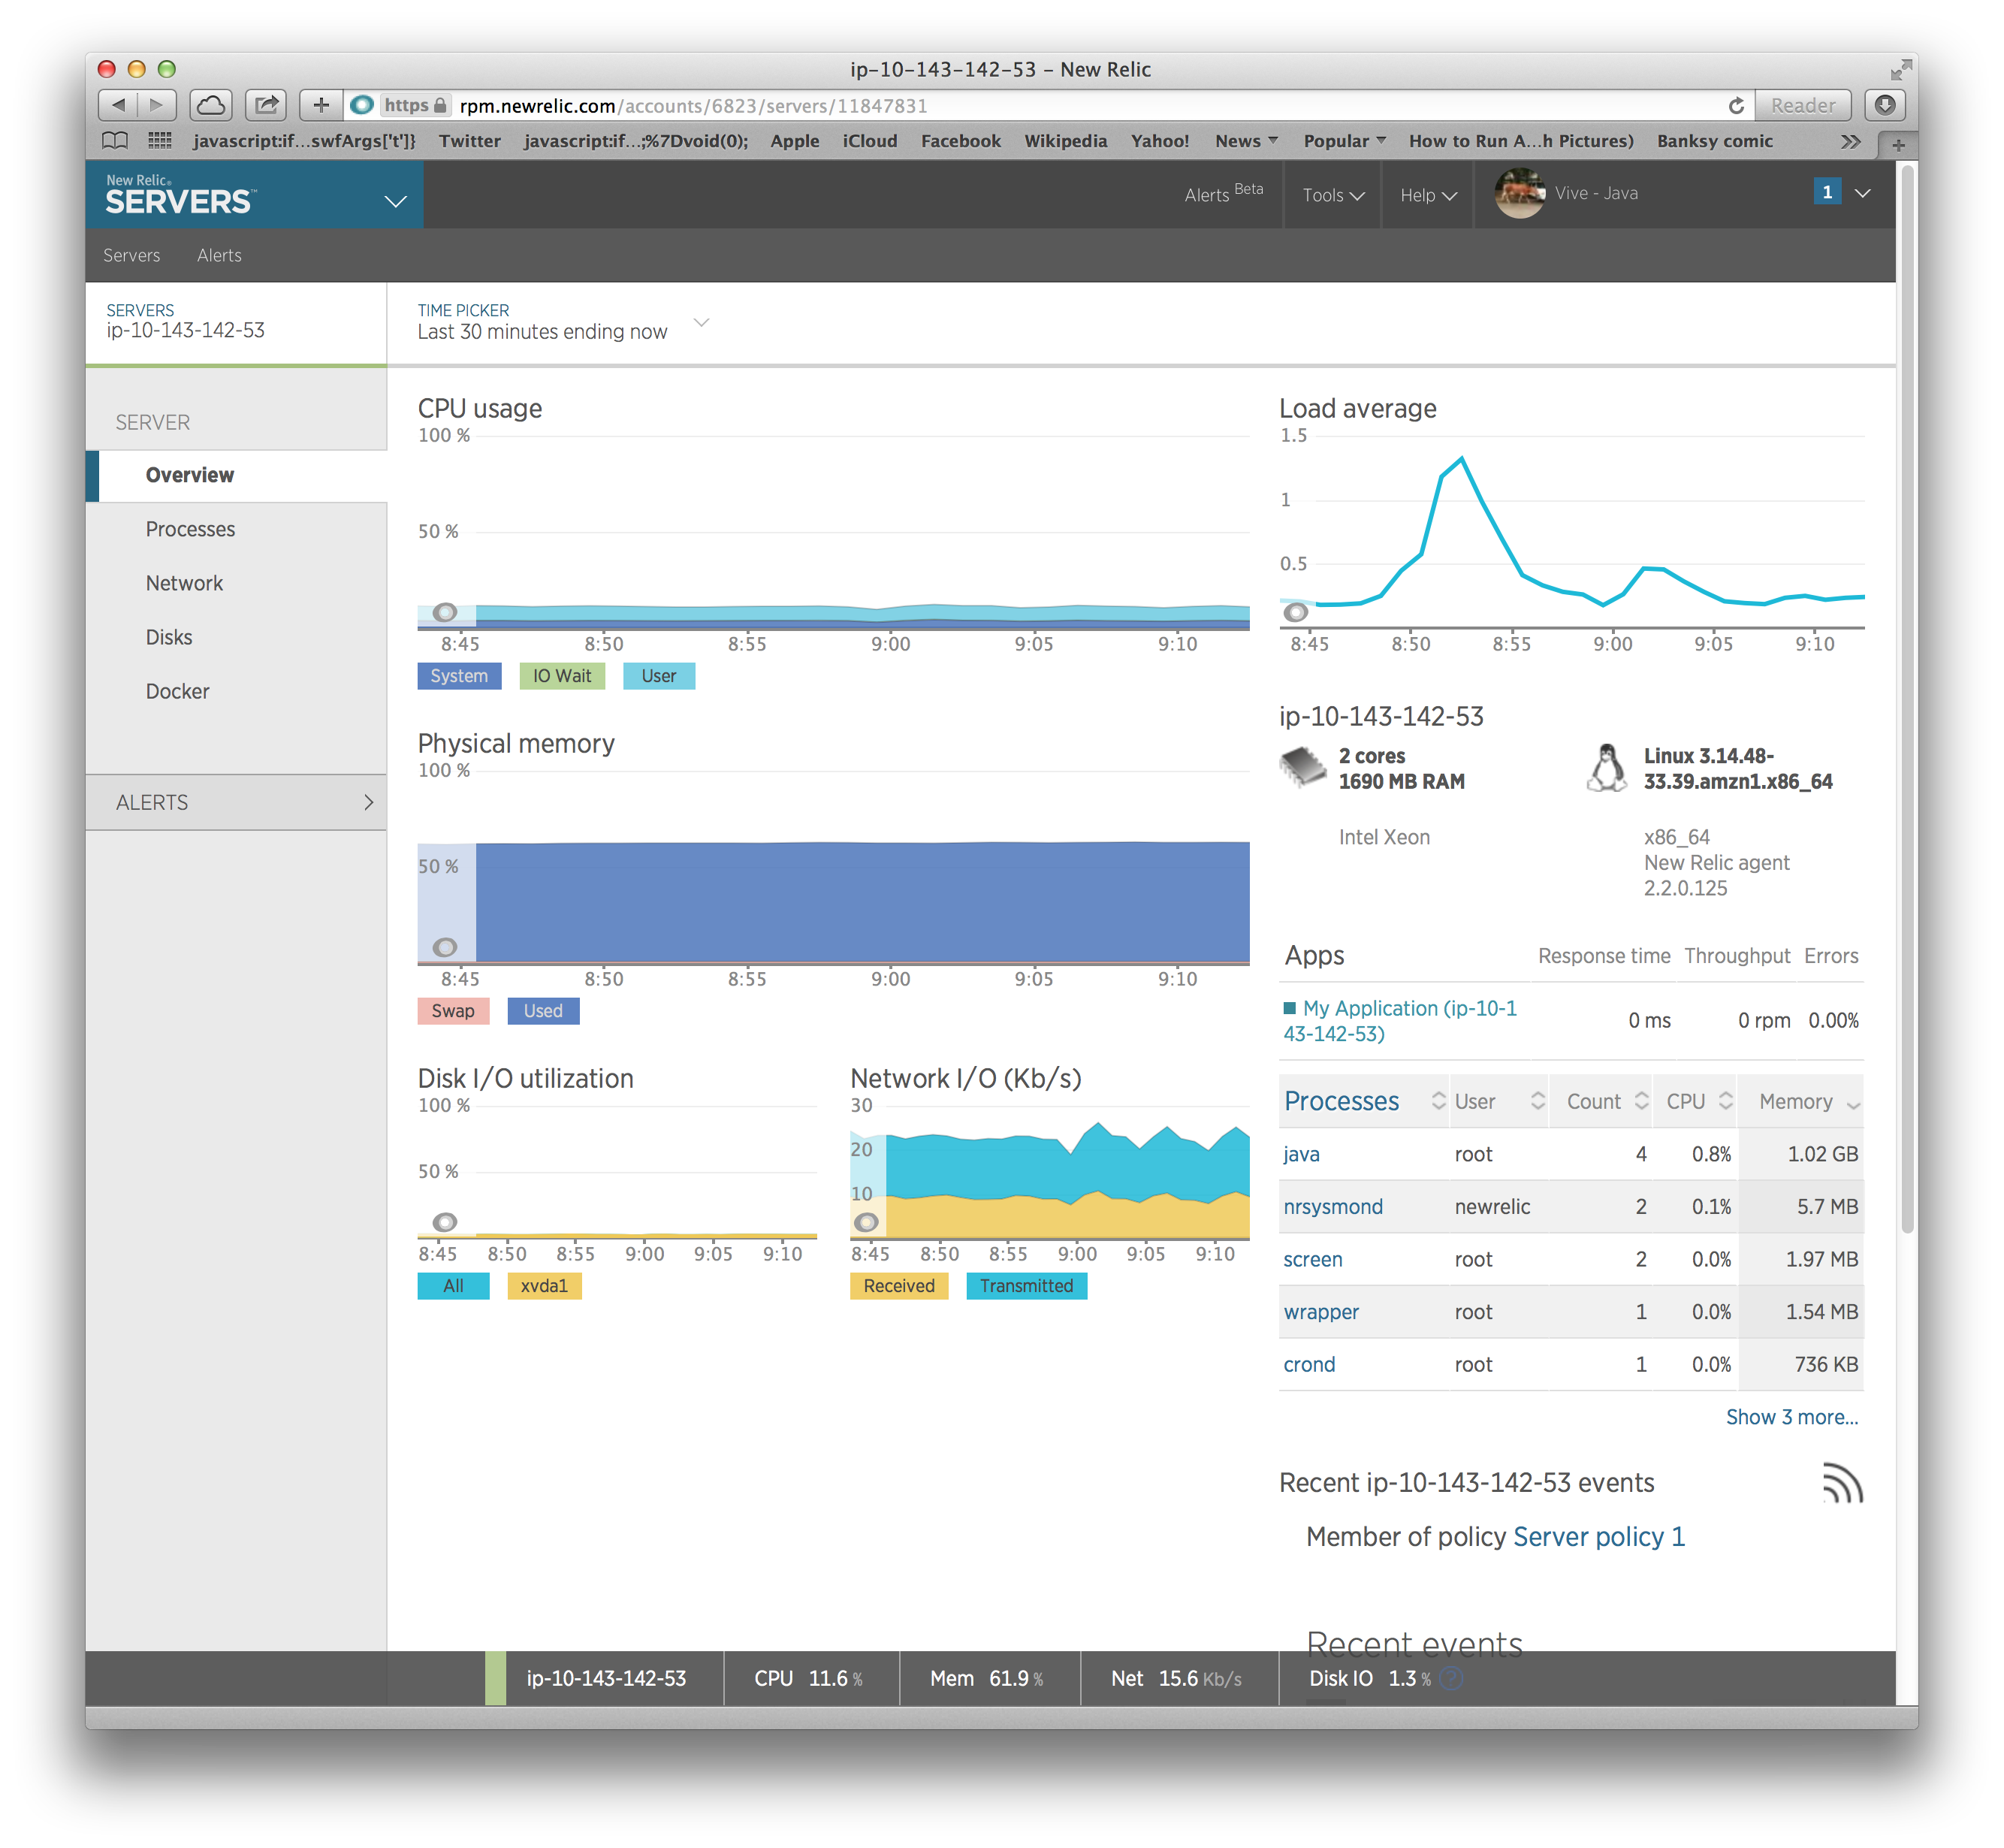
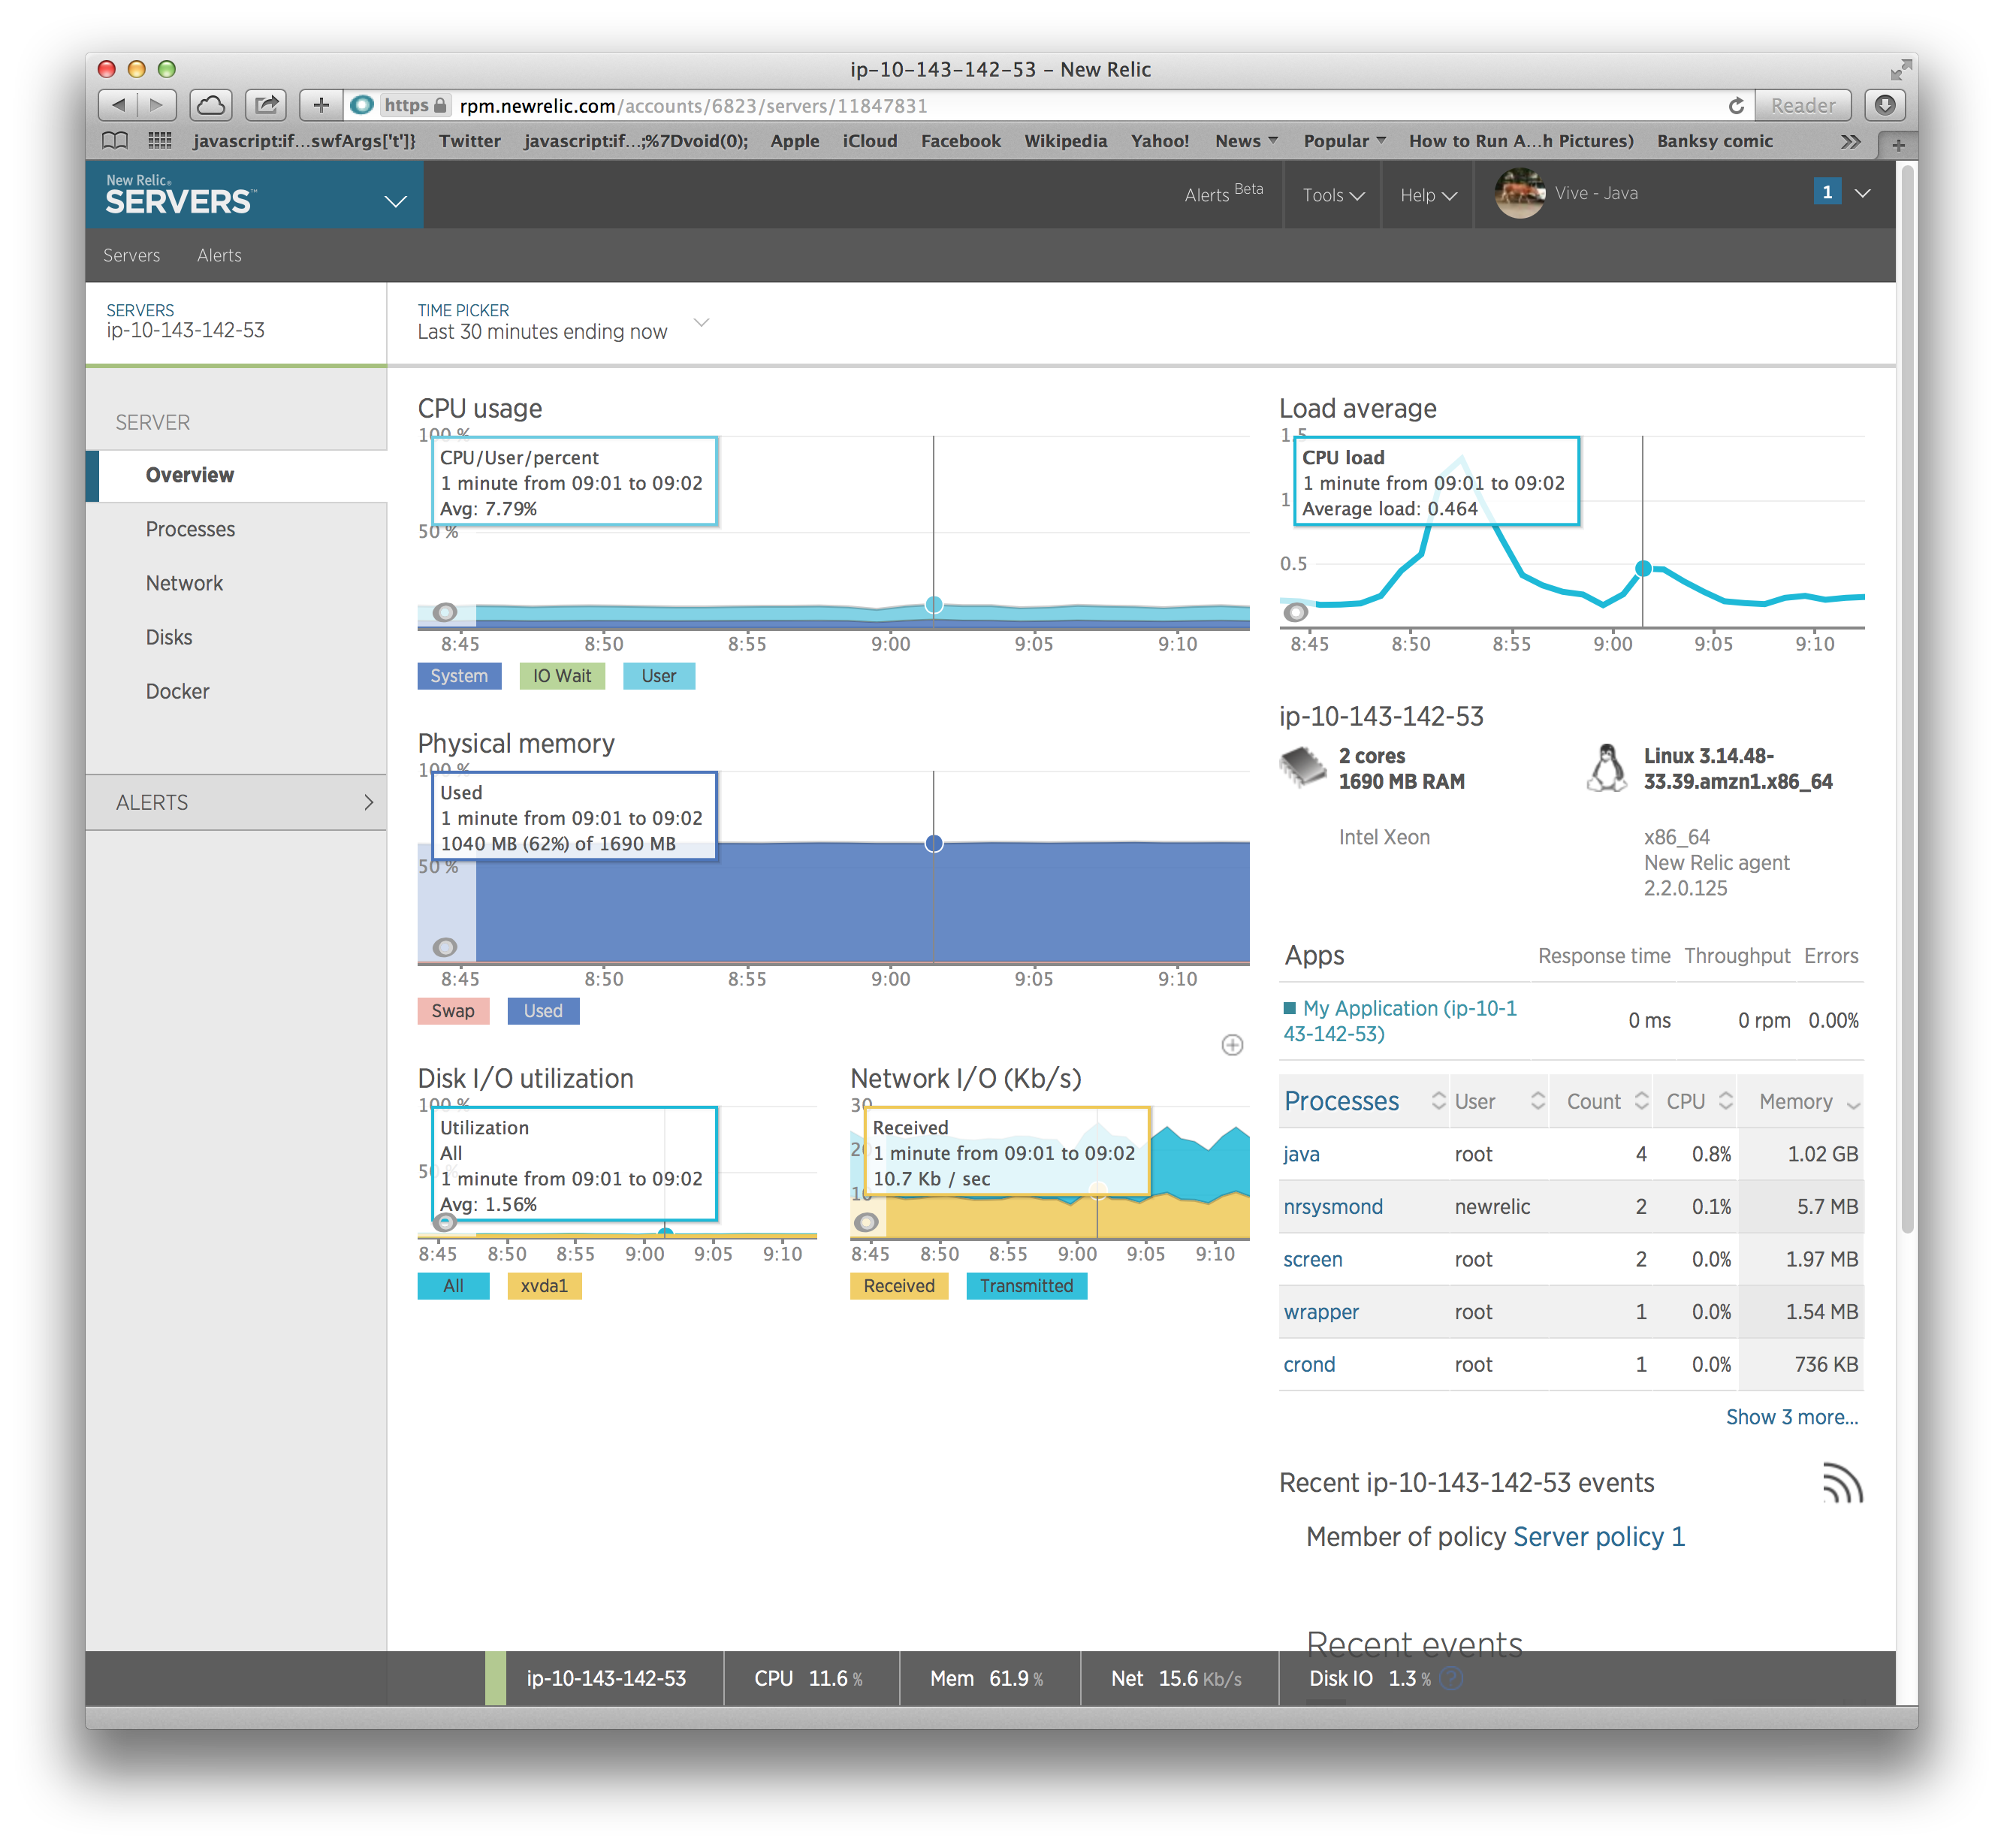
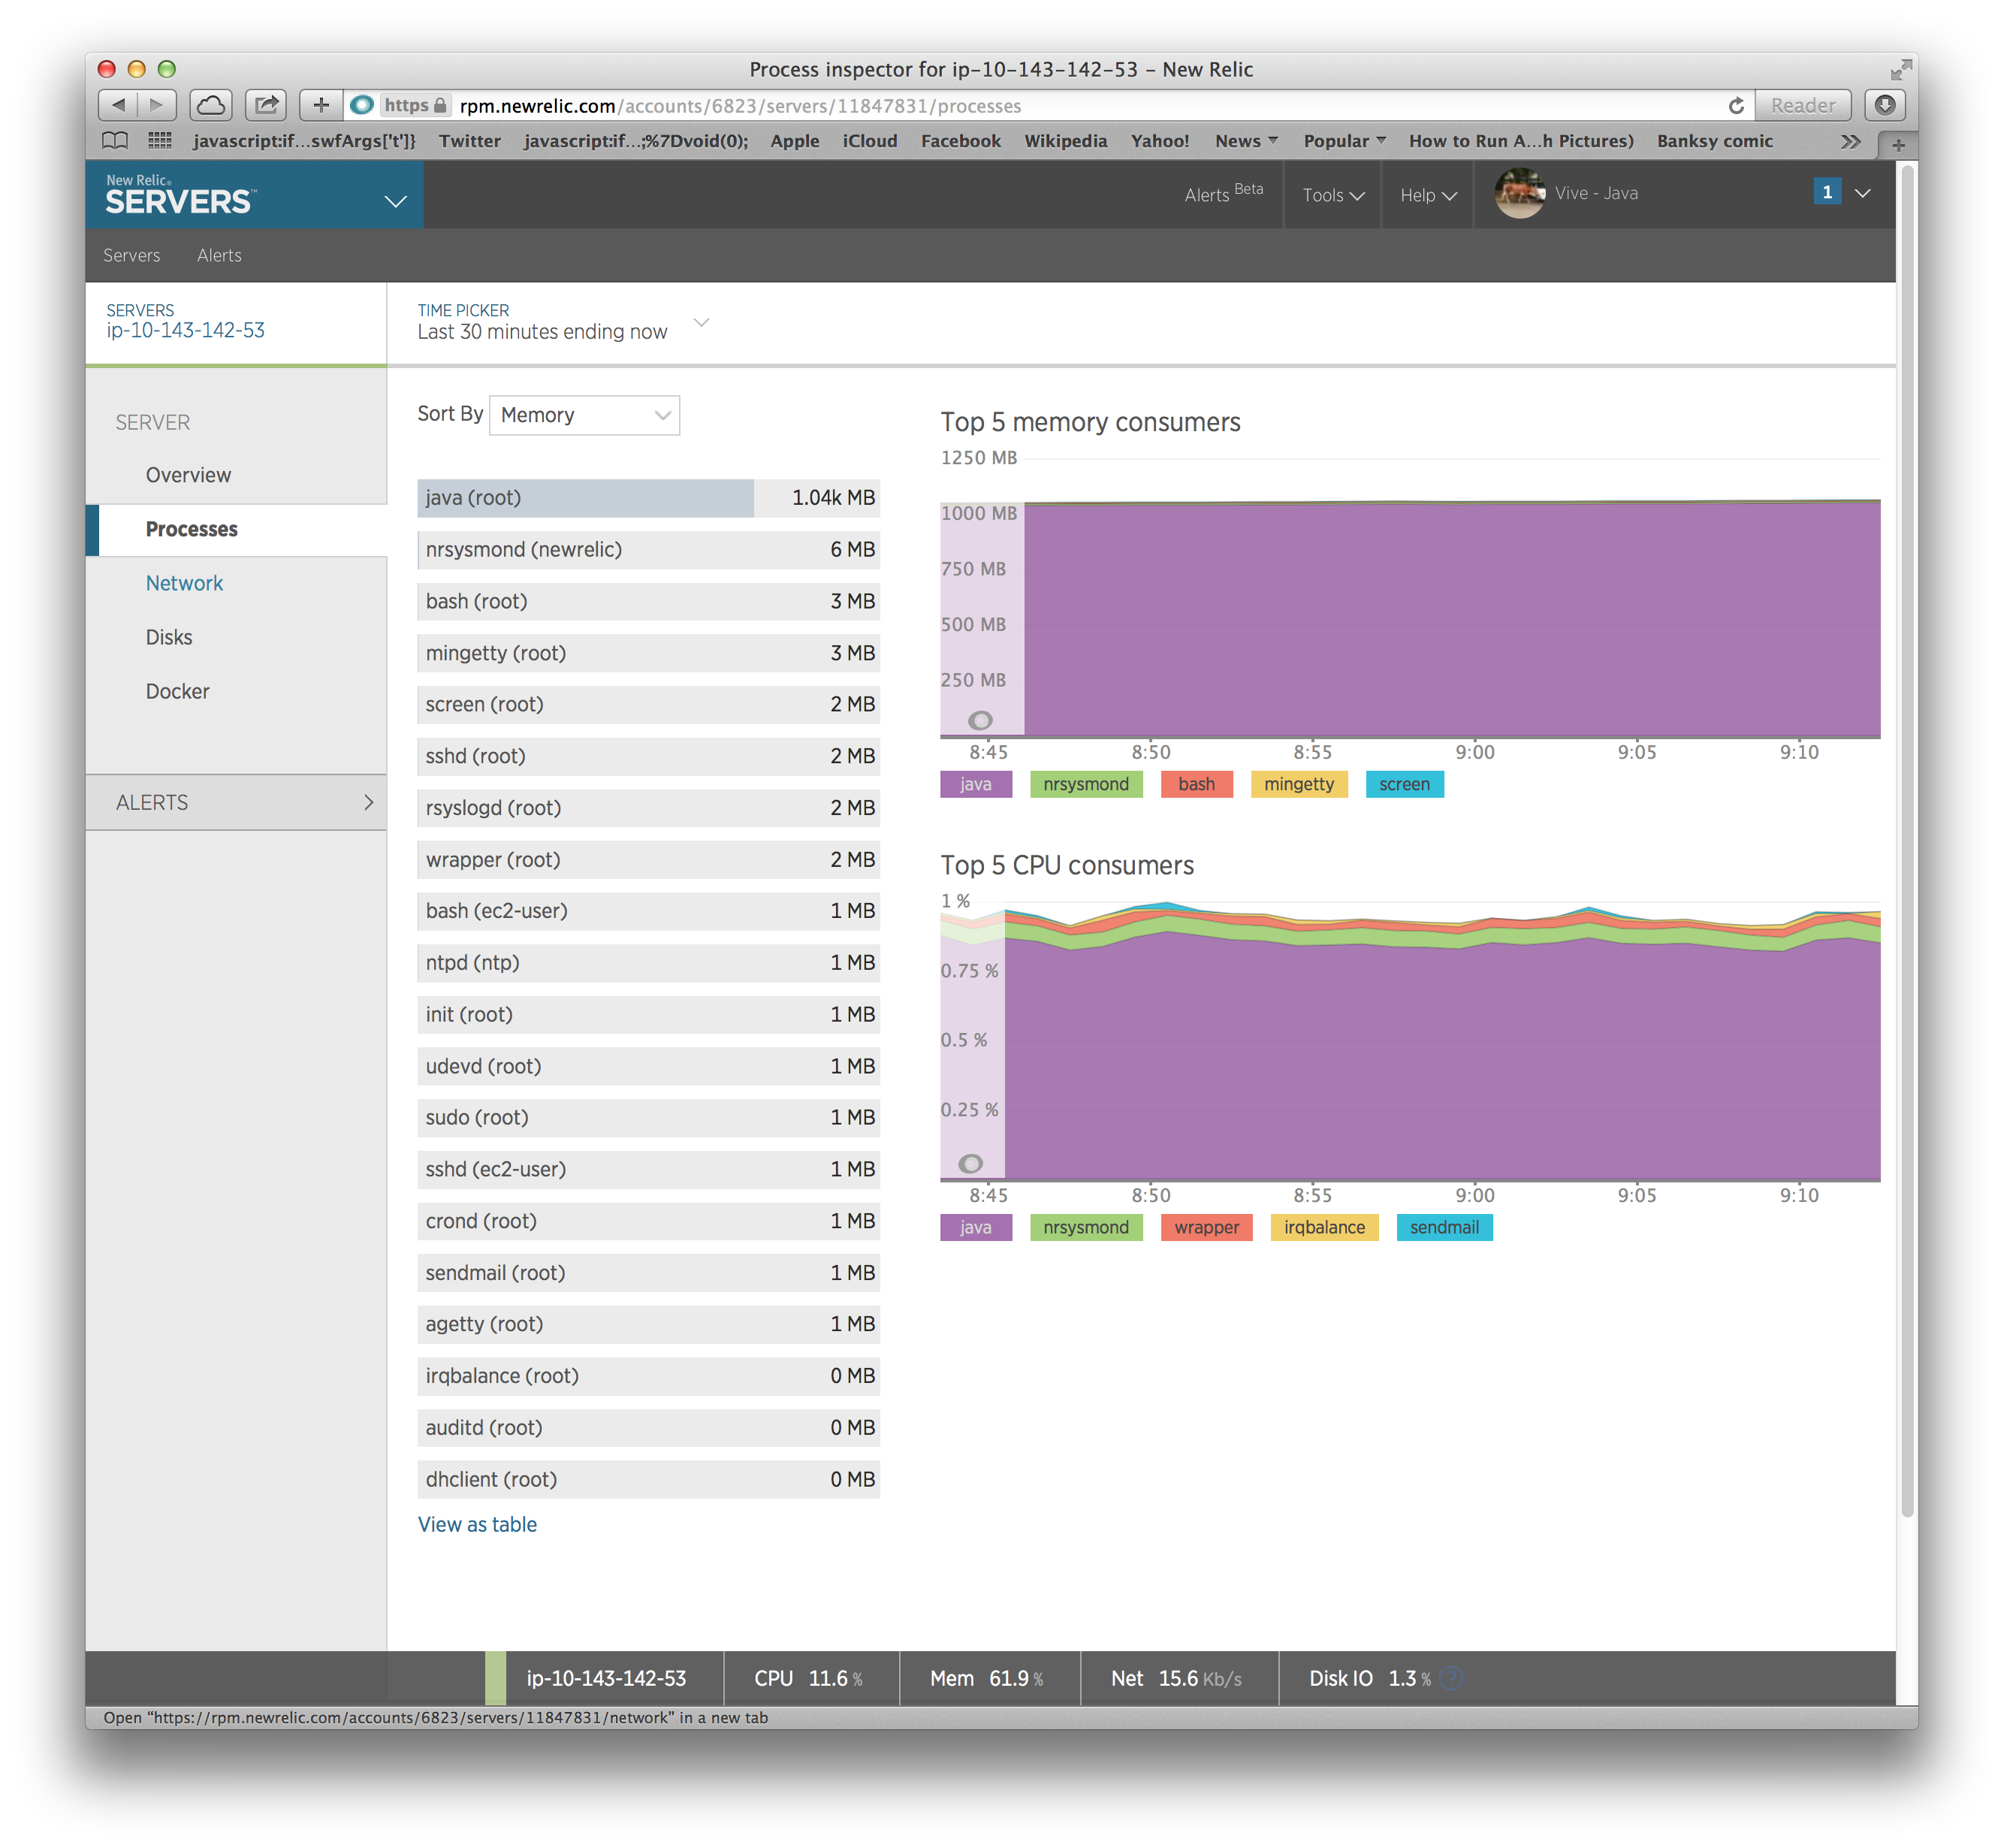
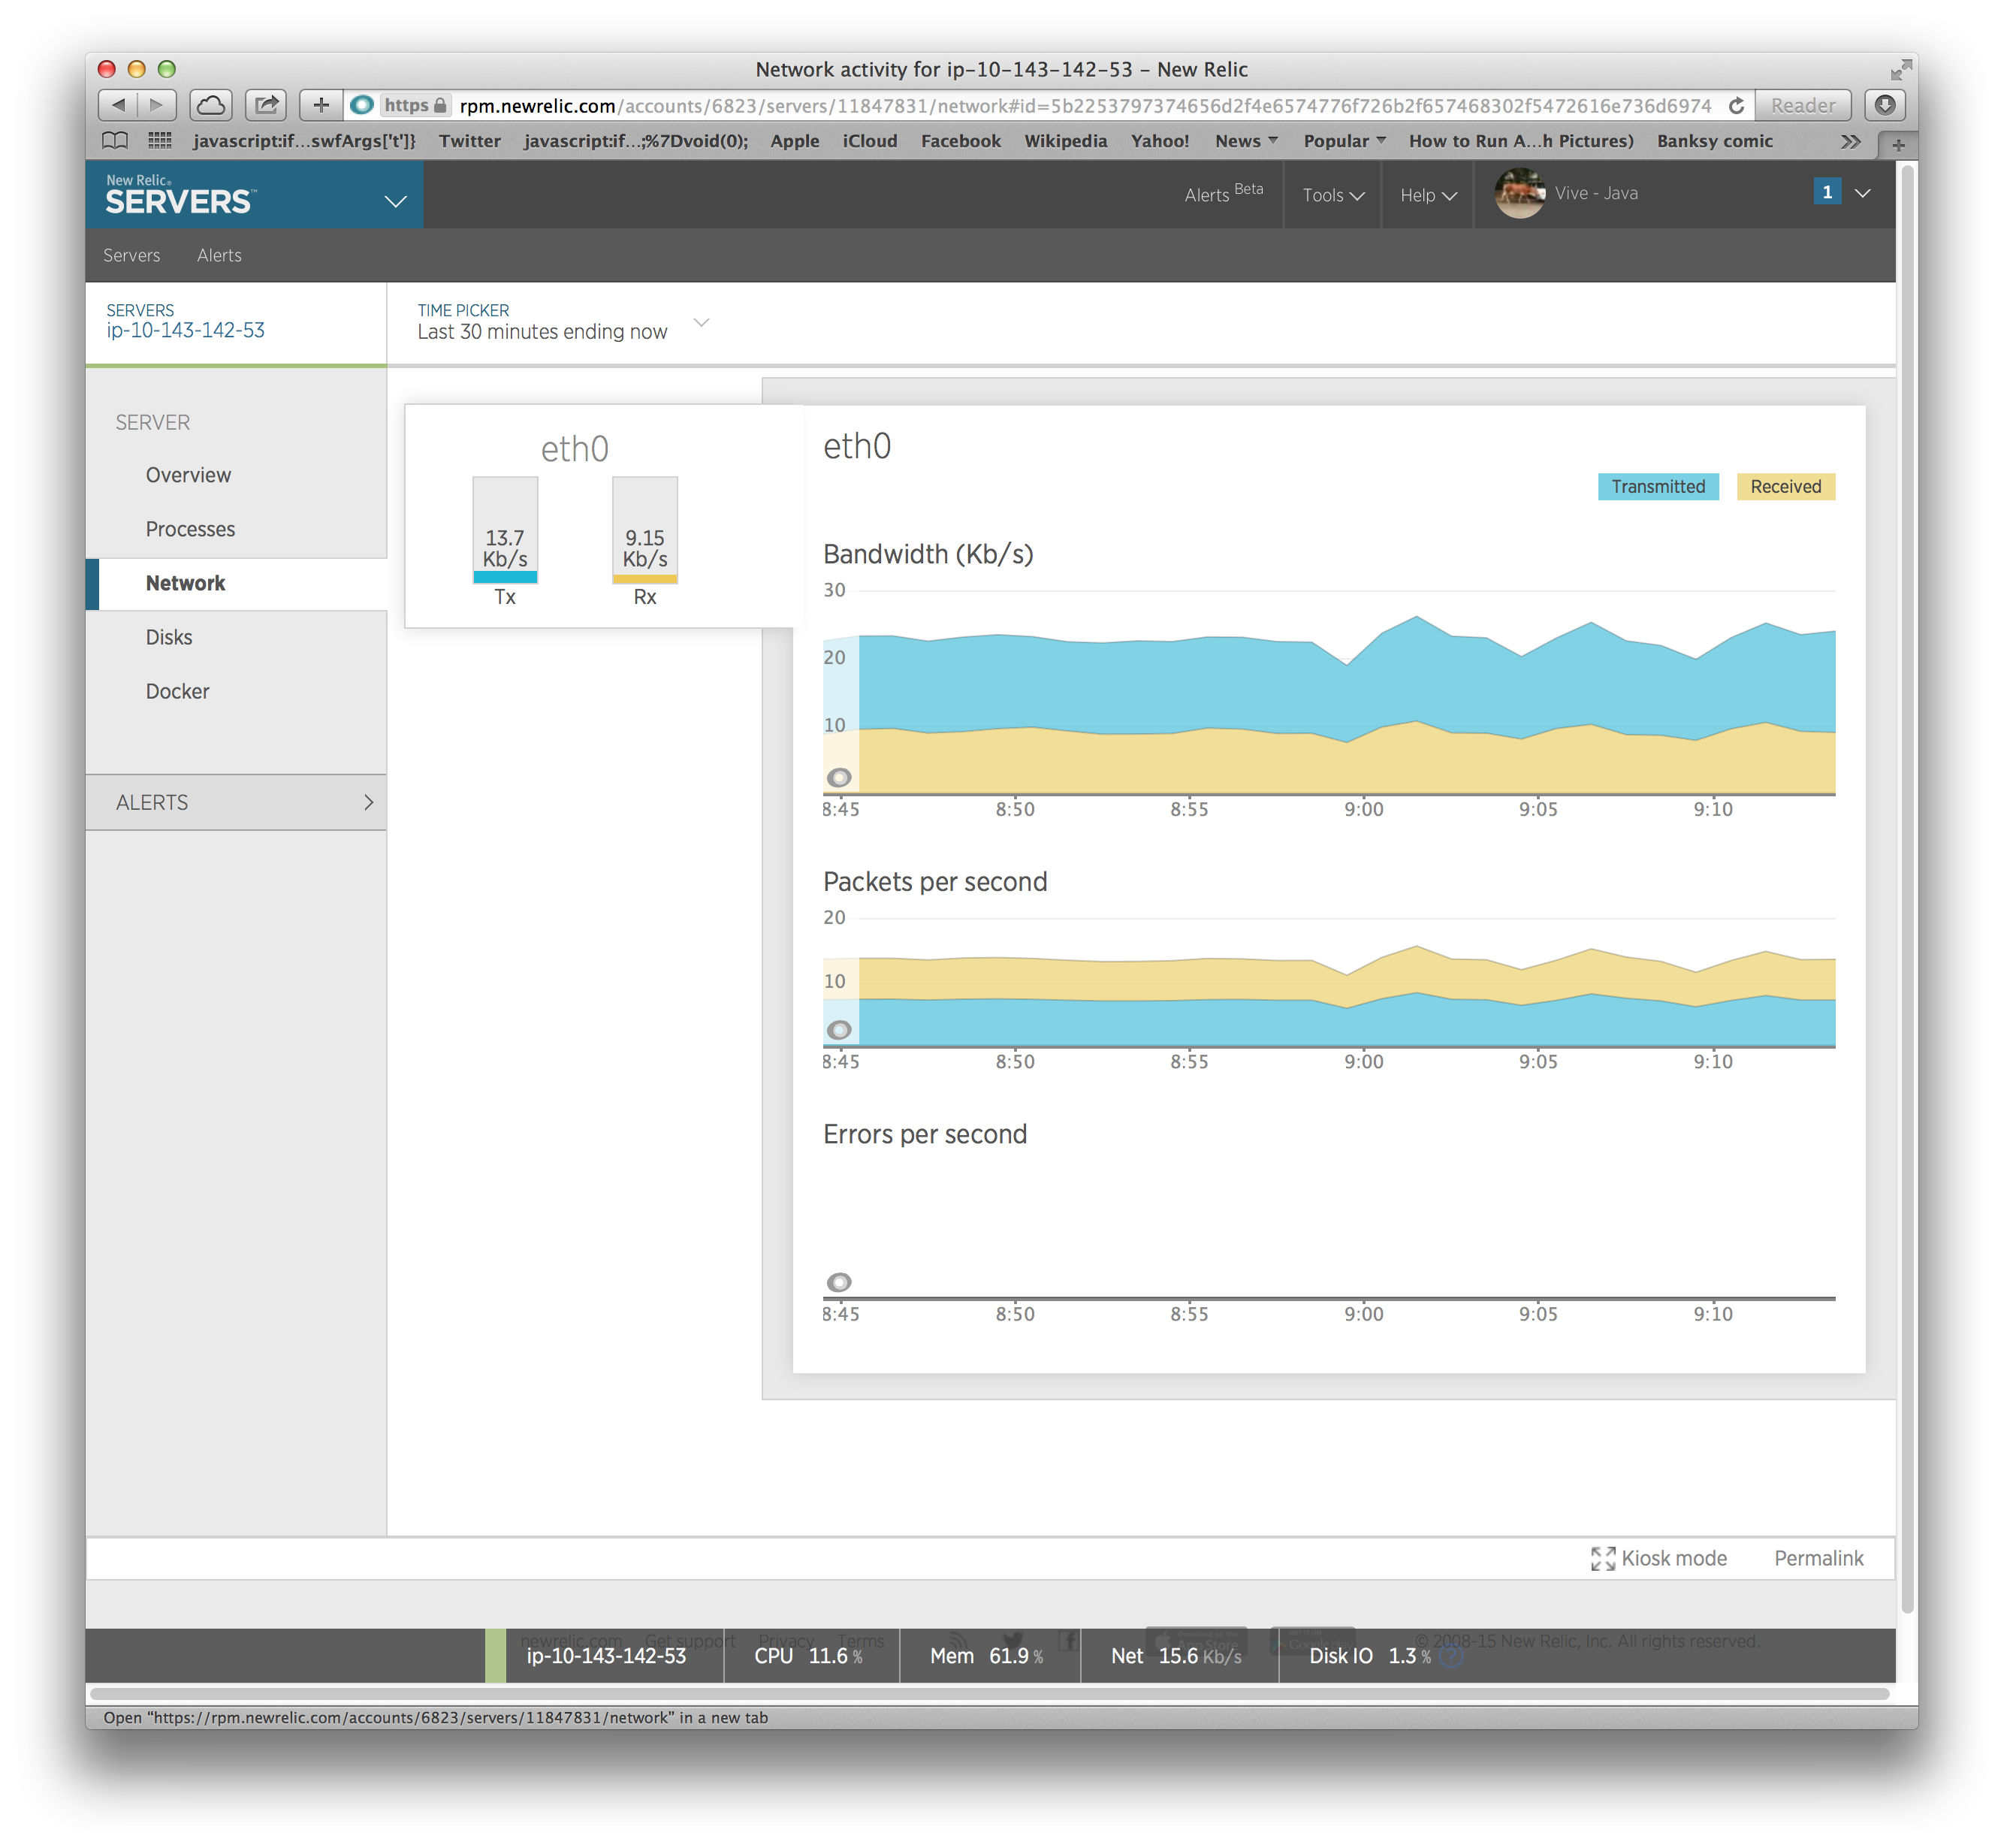
After doing this and waiting for the metrics to hit the NewRelic servers, we get some nice visuals:
Operational Monitoring: Nagios and Icinga
The above monitoring is not ‘alert’ oriented. It lets you drill into the details of what is happening in operations both currently and somewhat into the past. To be a bit more alert oriented, you need to go down a different path. The most mature open source path is the Nagios / Icinga double path (http://nagios.org/, http://icinga.org/).
An important aspect of monitoring is to have multiple monitors on your network. And, in general, for the monitors to be outside the data center. Agents within the data center can relay information out, but if your monitors fail inside the data center, you are (unknowingly) blind.
So for Nagios, we can demonstrate monitoring from the developers (or operations dashboard) machine vs. within the data center. Because of the presence being visible from anywhere, monitoring configuration can happen anywhere that you can pull out a git repository.
Examples of Nagios views are:
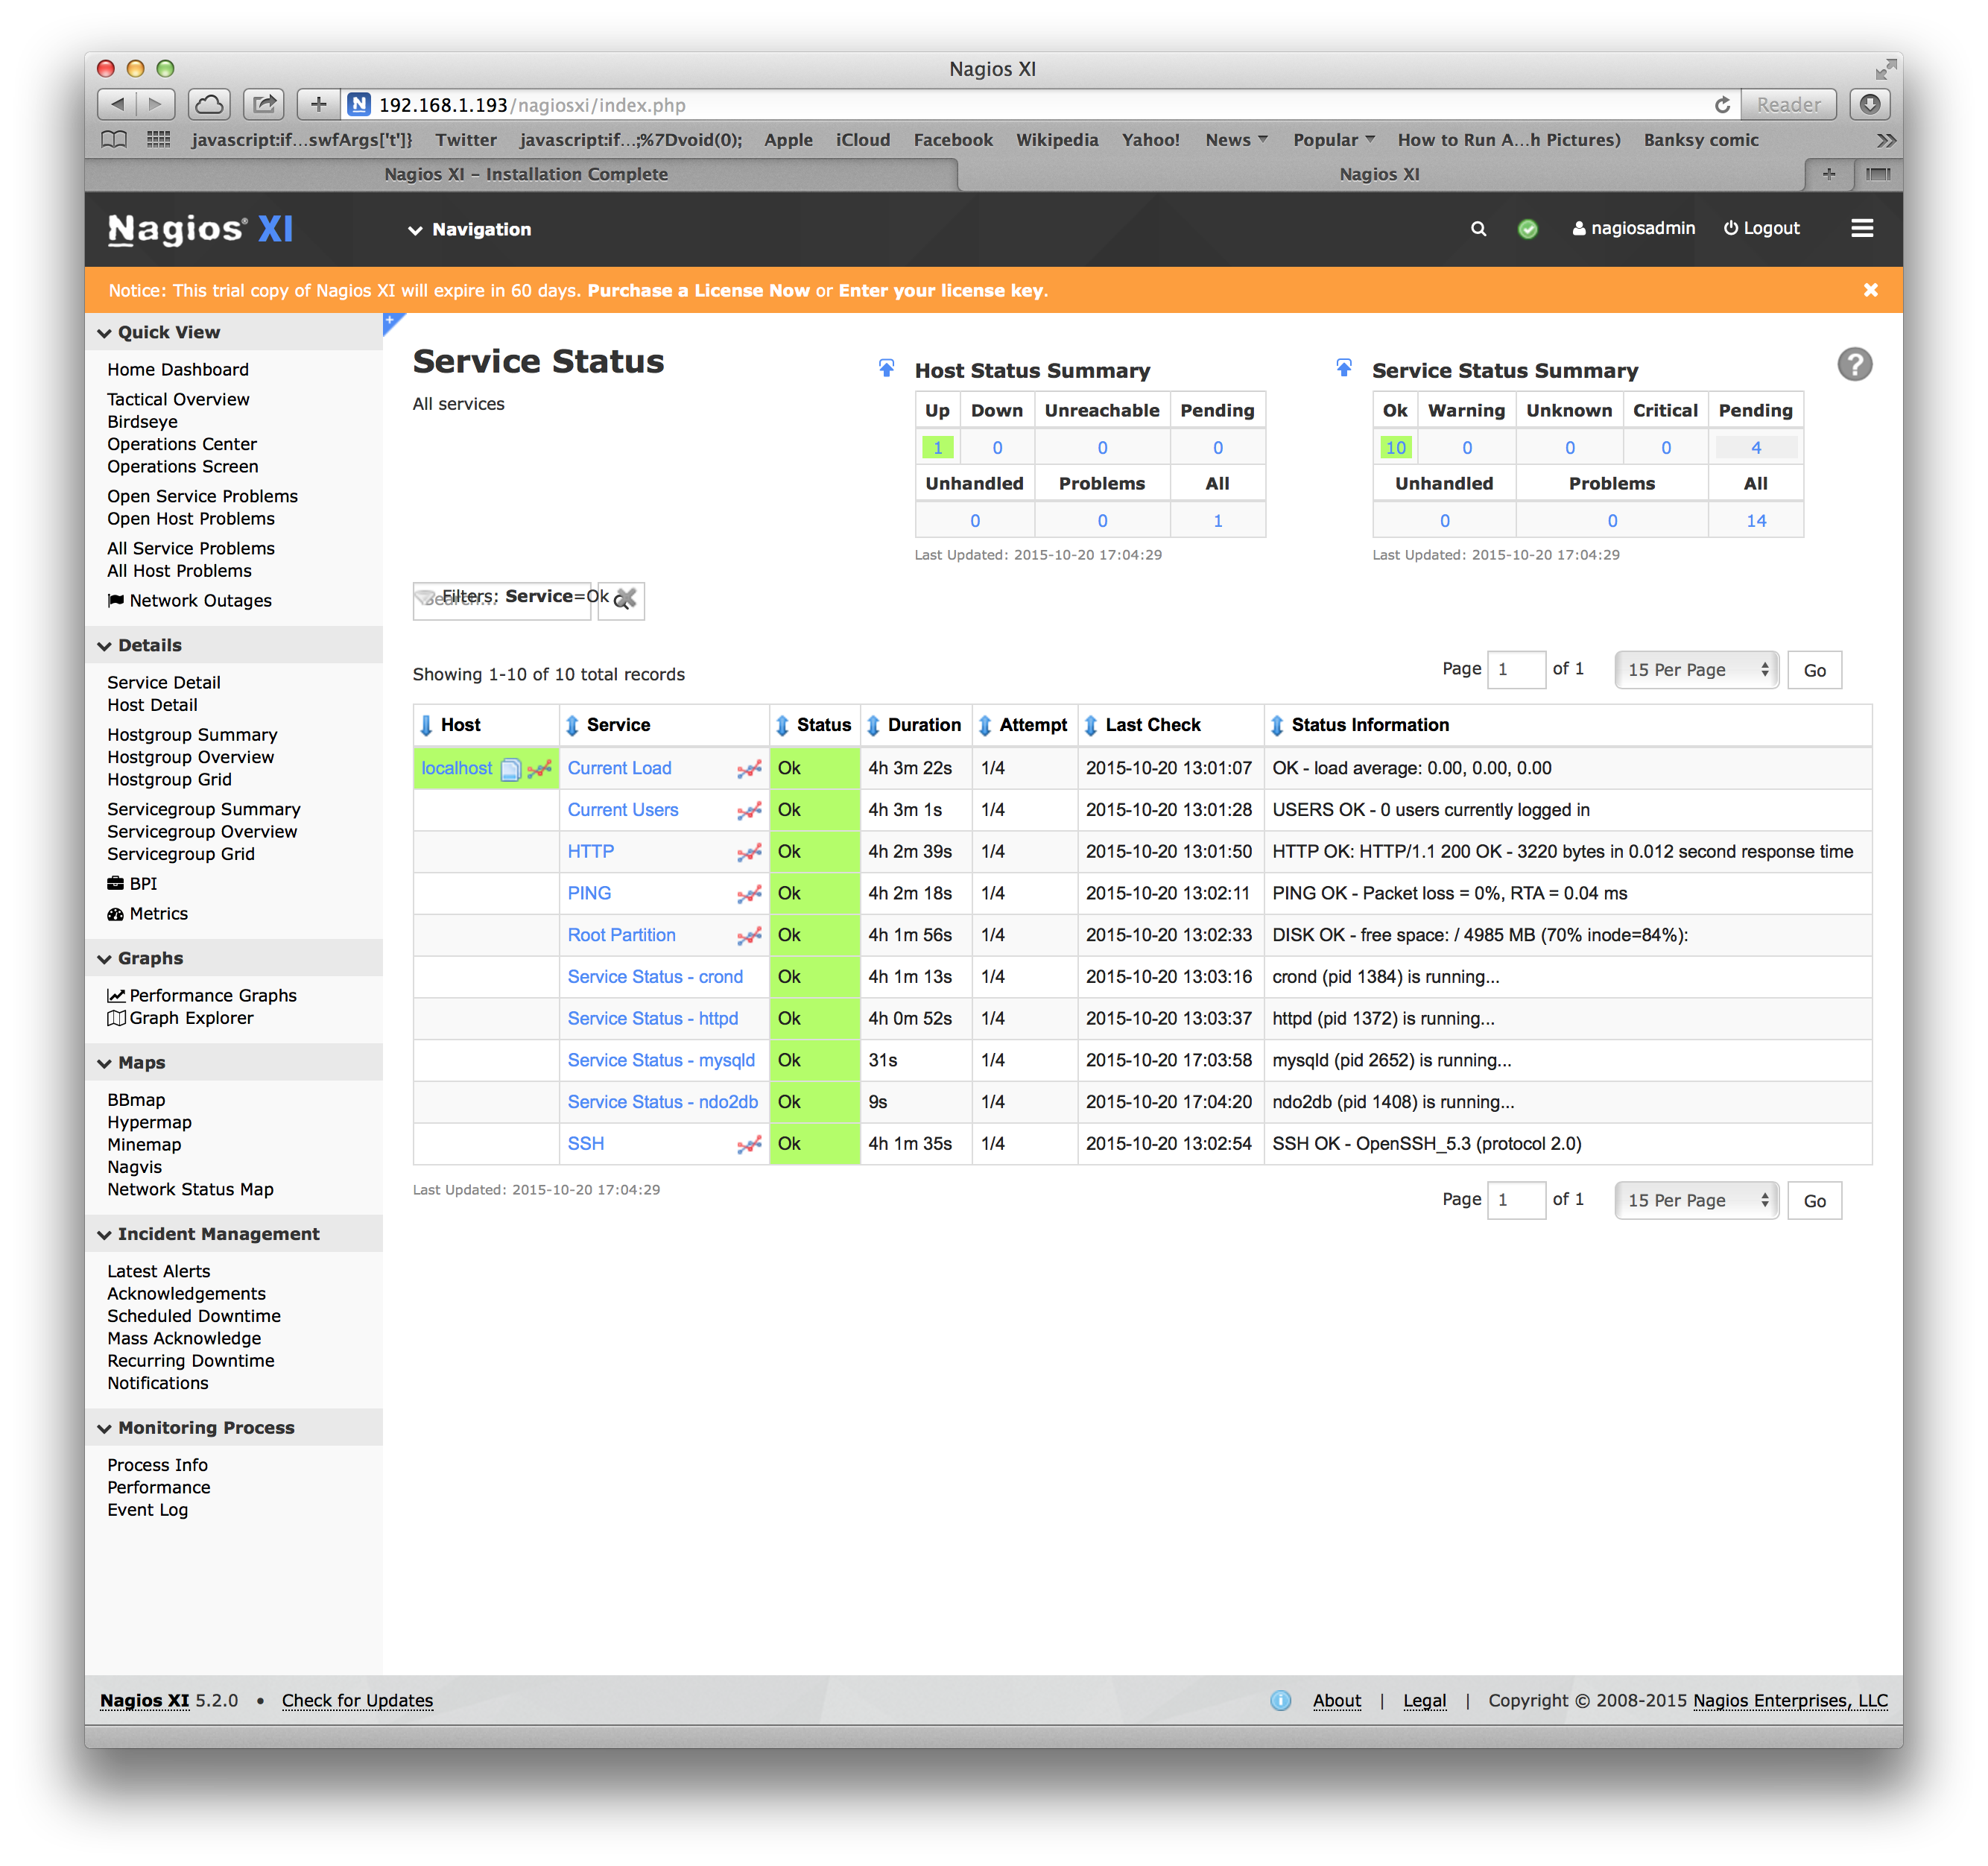
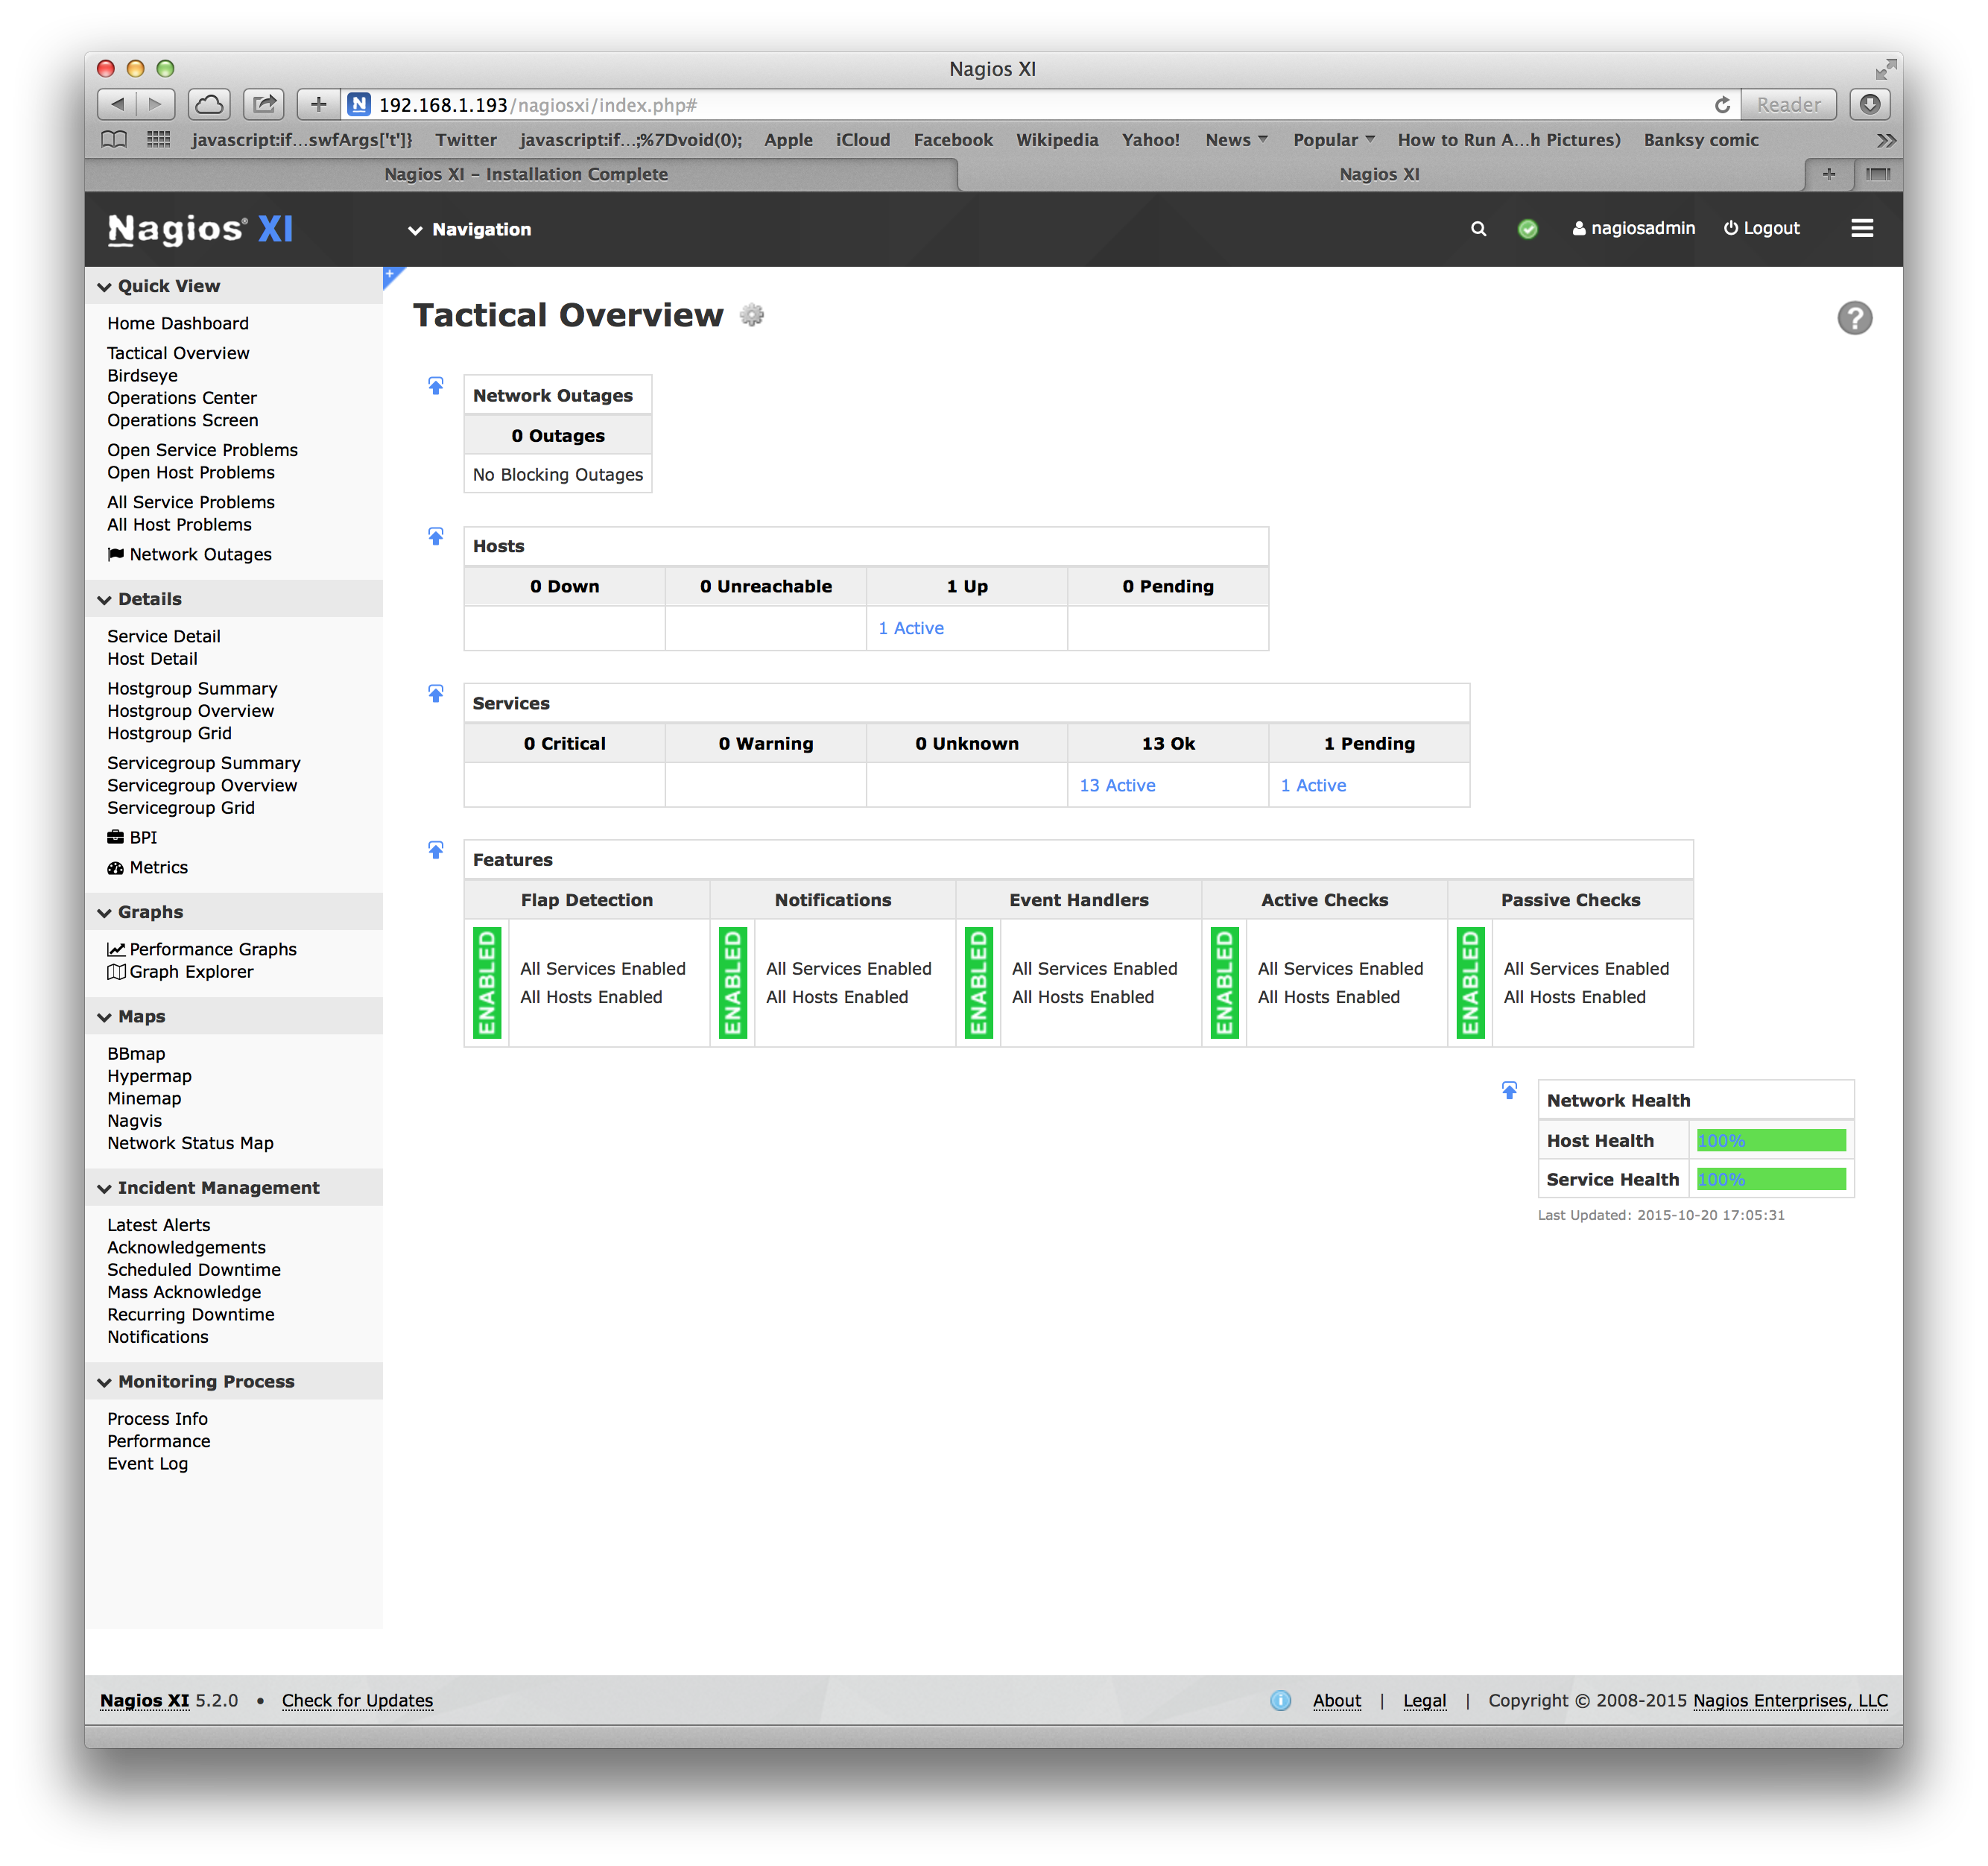
Where the lists of hosts to monitor and what to monitor comes from text configuration files.
1 2 3 4 5 6 7 | |
And these files can trivially be generated from the presence information, and updated if anything changes. An important aspect is to make sure to turn off the monitoring system when a node is going down intentionally. So the ‘node_state’ status and ‘node_app_state’ status are critical to have come through the presence information for monitoring to not be ‘noisy’. A noisy monitor is a monitor that will quickly be forever ignored.
Although Nagios and Icinga have dashboards, everything should go into HipChat so everyone can see the history and stability/instability of the system. You can even publish the status publicly so your users will know there is a production problem. If you enable public chat in either HipChat or elsewhere, the users can both see the status and ask for predictions of when issues are resolved. A much higher-touch relationship with users can make them longer users (this retention aspect was very true of Winster where the CEO was online and could be chatted with a good portion of the evening. Kind of like walking the floors of the casino or Tim Cook being in the University Apple Store.).
Conclusion
Although it is more operational than “application stack”, the ability to monitor and analyze your application’s performance and behavior is critical to any production deployment of it. So you should think about it early and not as an afterthought. All logging should go into the logging pipeline (no System.println or equivalent) and be searchable through that pipeline at one or more aggregators. Start out with a metrics system like NewRelic to get a bunch of valuable things for free and you can later add in new application-specific metrics. And get the basics of operational monitoring up early and you will know if the application and the IT is reliable long before it gets into the production data center.